

Motilal Oswal mutual fund has launched a NFO (i.e. New Fund Offer) which is a index fund tracking Nifty Microcap 250 TRI for passive investing. The NFO opens on 15th June and closes on 29th June. Lets deep dive into the charts and see what we believe about this fund.
Summary : We like this index fund
Motilal Oswal Nifty Microcap 250 TRI Index fund follows Nifty Microcap 250 TRI Index and therefore, fund manager’s role is limited to replicate any changes in the underlying index. So to analyze this index fund we will take a deeper look into Nifty Microcap 250 TRI Index.
About Nifty Microcap 250 TR Index
The Nifty Microcap 250 index aims to track the performance of microcap stocks listed or permitted to trade on NSE. The index includes the top 250 companies beyond the Nifty 500 index constituents, selected based on their average full market capitalization. A stock’s weight is based on its free-float market capitalization.
Index Methodology
Index was launched on 10th May 2021 and with base date from 1st April 2005. Index is rebalanced semi annually on 31st Jan and 31st July every year.
Eligibility : Top 1000 companies based on average daily turnover and on average daily full market capitalization based on previous six months period data. excluding stocks forming part of Nifty 500. Companies must be traded 90% of days during the previous 6 month period to be included in the index.
Selection Criteria : From all the eligible stocks exclude stocks forming part of Nifty 500 and select top 250 stock form the remaining stocks based on on their average daily full market capitalization based on previous six months period data.
Rebalancing : Semi-Annually
Source : Nifty Microcap 250 TR Index Fund Factsheet . NSE Indices
Nifty Microcap 250 Index Performance
The index was launched in May 2021, which is around 2 years but the index is reconstituted way back in April 2005 that’s over a decade long period This gives us a comprehensive performance track record.
So how has the NIFTY Microcap 250 Index done compared to the underlying index it picks stocks from, the NIFTY 50 & Nifty Smallcap 250?
Chart shows the cumulative performance of the NIFTY Microcap 250 TR Index (green line) from Apr 2005 to May 2023.

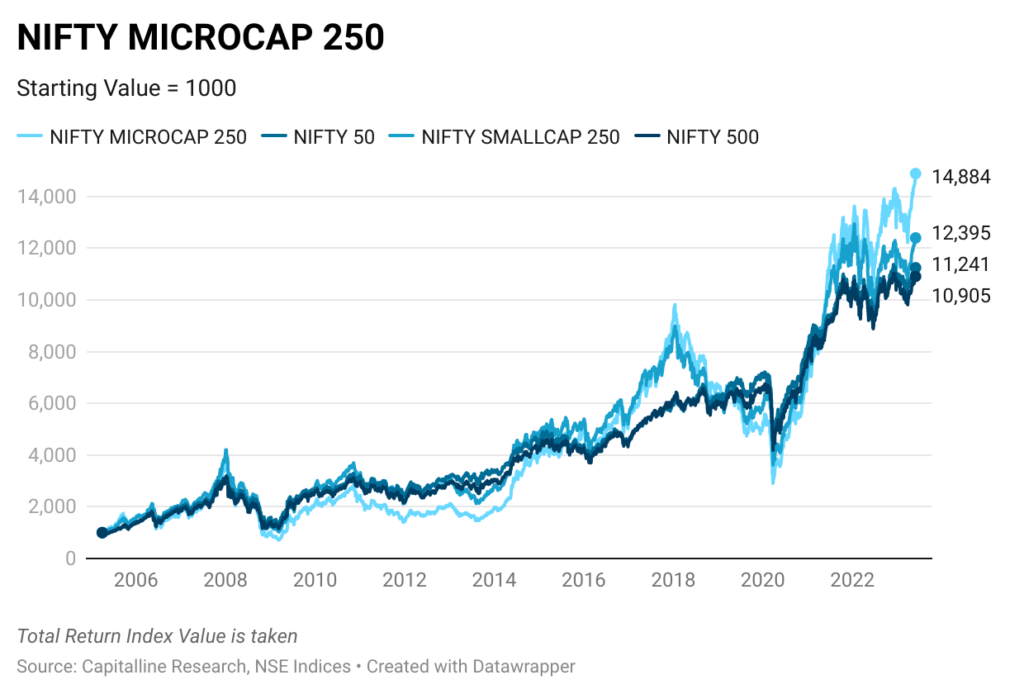
Rs.1 invested in Nifty Microcap 250 Total Return Index in April 2005 would be now Rs.14,884 (14x) compared to Rs. 12,395 (12x) in Nifty SmallCap 250 TR Index and Rs. 11,241 (11x) in Nifty 50 and Rs. 10,906 (10x) in Nifty 500.
That looks like a massive outperformance when compared with Nifty 50. but absolute return cannot be the form of basis of judgement..
The above chart shows that the index underperformed from 2011 till 2015 and then there is a divergence in the performance.
Chart below shows calendar year-wise performance of the indices.


Nifty Microcap 250 index out performed 7 out of 9 years. And underperformance were only in 2019 and 2020 but this can also be incomplete information to decide since it has starting point biases
To avoid starting point biases, we will compare rolling return of 3 yr, 5yr and 10 yr
3 Yr Rolling Return & Annualized Return Distribution
Below chart represent the distribution of probability of annualized returns when held for 3 years. Larger a bar, the more chances of getting that return.(chart is interactive hover over the bars to highlight them)
If you would have held the Nifty Microcap 250 Index for 3 years, there is 12% probability of getting returns in between 10-20% vs 52% probability in Nifty 50 and 22% probability in Nifty Small Cap 250 Index.
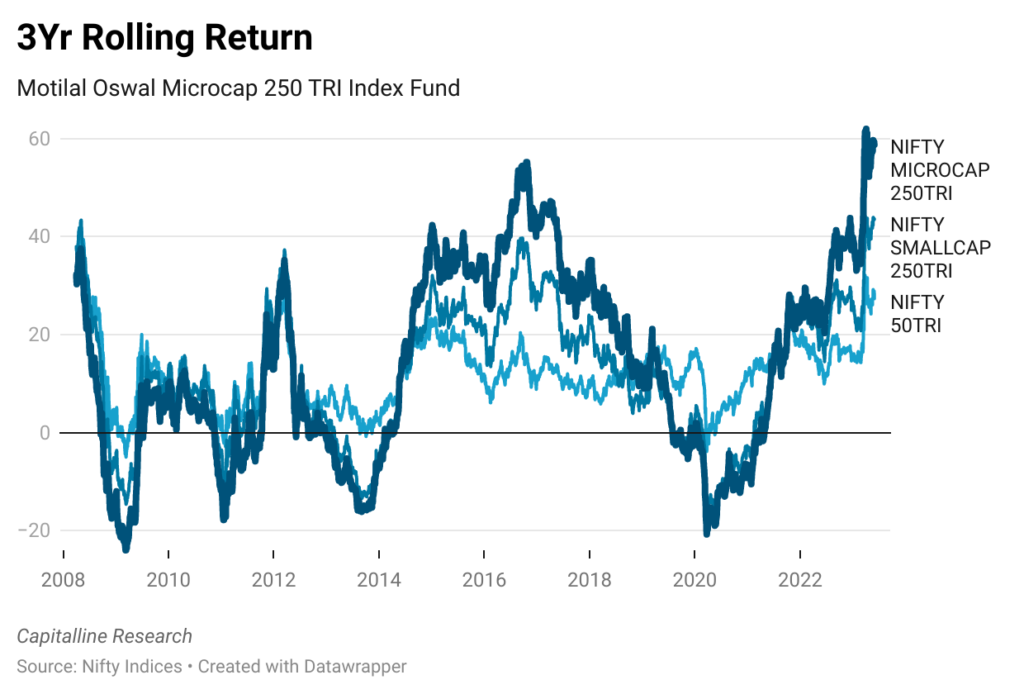
Chart below is simple 3yr rolling return chart of NIFTY Microcap 250 TR Index , Nifty Smallcap 250 TR Index and Nifty 50. If index is held for 3 years it has outperformed Nifty 50 by 43.99% and nifty Smallcap 250 by 45.25% over trailing 3-year rolling return.
5 Yr Rolling Return & Annualized Return Distribution
Below chart represent the distribution of probability of annualized returns when held for 5 years. Larger a bar, the more chances of getting that return.(chart is interactive hover over the bars to highlight them)
If you would have held the Nifty Microcap 250 Index for 5 years, there is 40% probability of getting returns in between 10-20% vs 63% probability in Nifty 50 and 41% probability in Nifty Small Cap 250 Index.
Chart below is simple 5yr rolling return chart of NIFTY Microcap 250 TR Index , Nifty Smallcap 250 TR Index and Nifty 50.In the above chart check the highlighted range there is a massive divergence in performance from 2016 till mid- 2018 which get wiped off in 2019 and 2020 fall.
If index is held for 5 years it has outperformed Nifty 50 by 49.37% and Nifty Smallcap 250 by 66.76% over trailing 5-year rolling return.
Similarly ,if you would have held the Nifty Microcap 250 Index for 10 years, there is 84% probability of getting returns in between 10-30% vs 72% probability in Nifty 50 and 75% probability in Nifty Small Cap 250 Index.
If index is held for 10 years it has outperformed Nifty 50 by 73.87% and Nifty Smallcap 250 by 85.79% over trailing 10-year rolling return.
Drawdown
Since Microcap companies comes in high risk high return category due to their inherent business size. Sometime companies also gets delisted or goes to bankruptcy so no analysis is complete unless drawdown is analyzed.
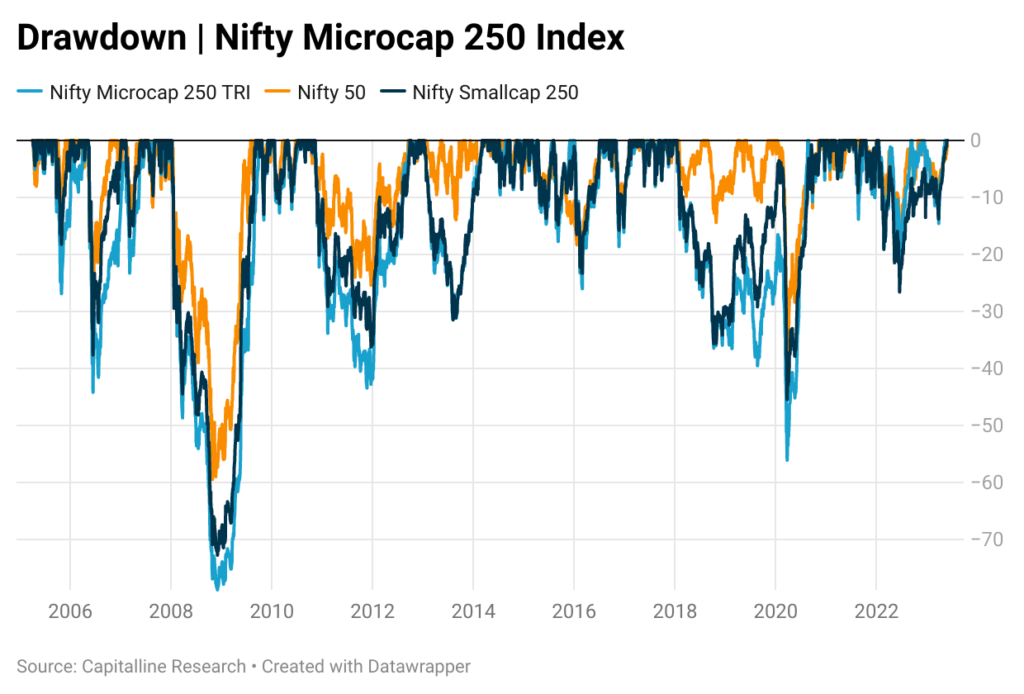
As the features of microcap companies suggest, drawdown chart shows the same's. NIFTY Microcap 250 TRI fall more than 80% of time compared to Nifty 50 and fell more than 69% compared to Nifty Smallcap 250 TRI.
Clearly from the above analysis Nifty Microcap 250 is a high risk and high return category and it is not suitable for all type of retail investor.
Other Important Factors
Motilal Oswal Nifty Microcap 250 Index Fund Page
Liquidity Issues :
The average free float market capitalization of companies is Rs.1,253 CR and smallest companies is Rs. 280 CR, it has a weight of 0.09% in the index. Average daily trading volume of stocks in index is Rs. 5.62 CR
Low liquidity could result in higher tracking error in replicating the index. As per Motilal Oswal, it will take around 3 days to trade approx. 100 CR. So buying and selling of companies could be an issue as and when index rebalancing happens and this issue will become bigger as the size of the fund grows. And Motilal Oswal said they will limit the flow as the AUM grows 500 CR.
One cannot ignore the fact that the stocks in microcap index are more used to circuits (due to news or corporate governance issues) ,which can be a challenge in managing tracking error to a lower level.
Index Rebalancing :
As per Fisdom Research , 25.6% stocks gets rebalanced every 6 months compared to 14.4% in Smallcap 250 or 10% Midcap 150 Index.
A high level of rebalancing will increase the cost and tracking error for index fund in illiquid market.
Conclusion : It can be ignored for better active managed fund in Smallcap category
We are quite sure that this is good interesting space to allocate some of your portfolio depending upon the individual risk. But passive investing is not the good choice as per our view. However there is no active managed fund in this category earlier before SEBI recategorization there is used to DSP Blackrock Micro Cap Fund which invest around 65% of the portfolio into micro cap stocks. Currently it is named as DSP Small Cap Fund with 45% exposure in micro cap stocks (Source : Livemint) .
One should invest in active managed fund in this category since there is more scope of generating alpha compared to passive investing. But while selecting the fund manager one need to be very cautious since the difference between the best performing and worst performing fund could be to wide.
Microcap Investing is not for everybody, it is for only people with very high risk appetite and one can consider a very small portion of portfolio for microcap investing.
These posts are independent and have no commercial relationship of any kind.
Please refer our Disclaimer Page before consuming this article.
In case of any issue with the article or data please tweet us @nishitagrawal9 or leave us a message